Stephen Roddy
![]()
![]()
![]()
![]()
![]()
![]()
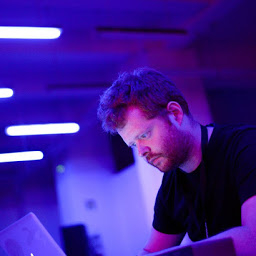
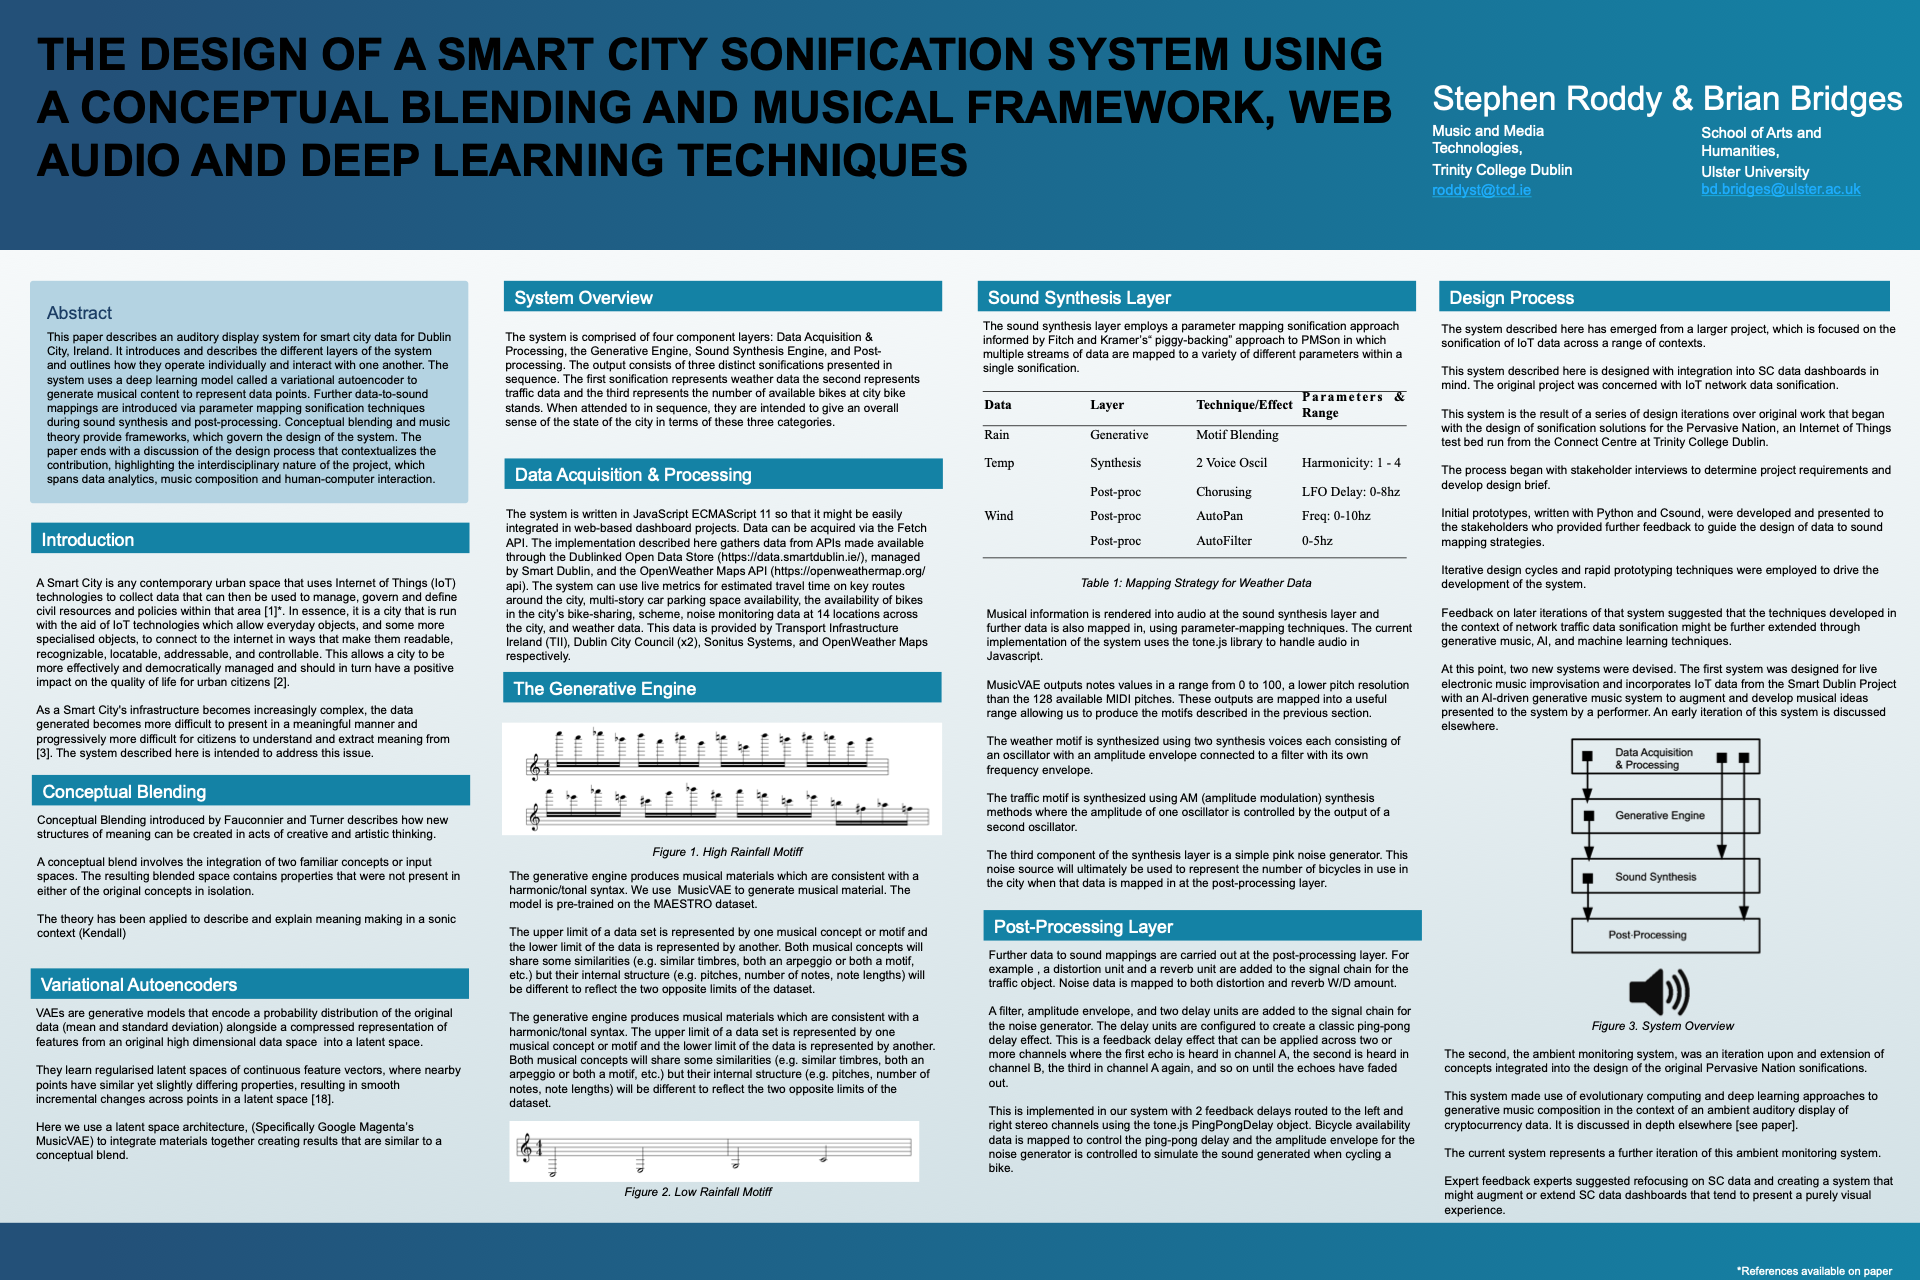
“An experimental composer from Ireland, Stephen Roddy proves equally adept at crushing soundscapes as he does mysterious melodies.”
- Bandcamp New & Notable, March 2022.
Auditory Display for Large-scale Internet of Things (IoT) Networks.
Project Description
Auditory Display for Large Scale IoT Networks was a Postdoctoral project I undertook at CONNECT, the Science Foundation Ireland Research Centre for Future Networks headquartered at Trinity College Dublin. The project was funded by an Irish Research Council Government of Ireland Postdoctoral Research Fellowship.
Research Process
This project was driven by the overarching research question: Can auditory display solutions present complex information in an intuitive manner in the context of IoT network monitoring tasks?. To answer this I began by talking to users who work with IoT networks, experts in the fields of IoT and Auditory Display and I also consulted the academic literature more generally.I broke the research question into smaller pieces: How can we best represent complex IoT data with sound? How useful can sound be for understanding data of this nature? What sounds should be used for different IoT data types and in what contexts? etc. I used theoretical frameworks from the field of Embodied Cognitive Science that apply to meaning-making and music cognition to ground the work in a meaningful context and I applied standard HCI methodologies to answer these questions posed above. This involved an iterative development process in which I would create a prototype solution based on the Embodied Cognition literature, evaluate the efficacy of the solution with users and then repeatedly iterate upon the design of the prototype taking the results of each successive evaluation into account.
Phase 1: Individual Network Specific Data Types.
Phase 1 of the project involved working with data from the Pervasive Nation a Low Powered Wide Area Network (LPWAN) infrastructure operated as an Internet of Things testbed by CONNECT, in Trinity College Dublin.
This phase involved the development of mapping strategies for representing network specific datatypes with sound. Beginning from principles in the field of embodied cognitive science and utilising user testing methods, I identified sets of useful mapping strategies for representing IoT data in different use contexts and task scenarios.
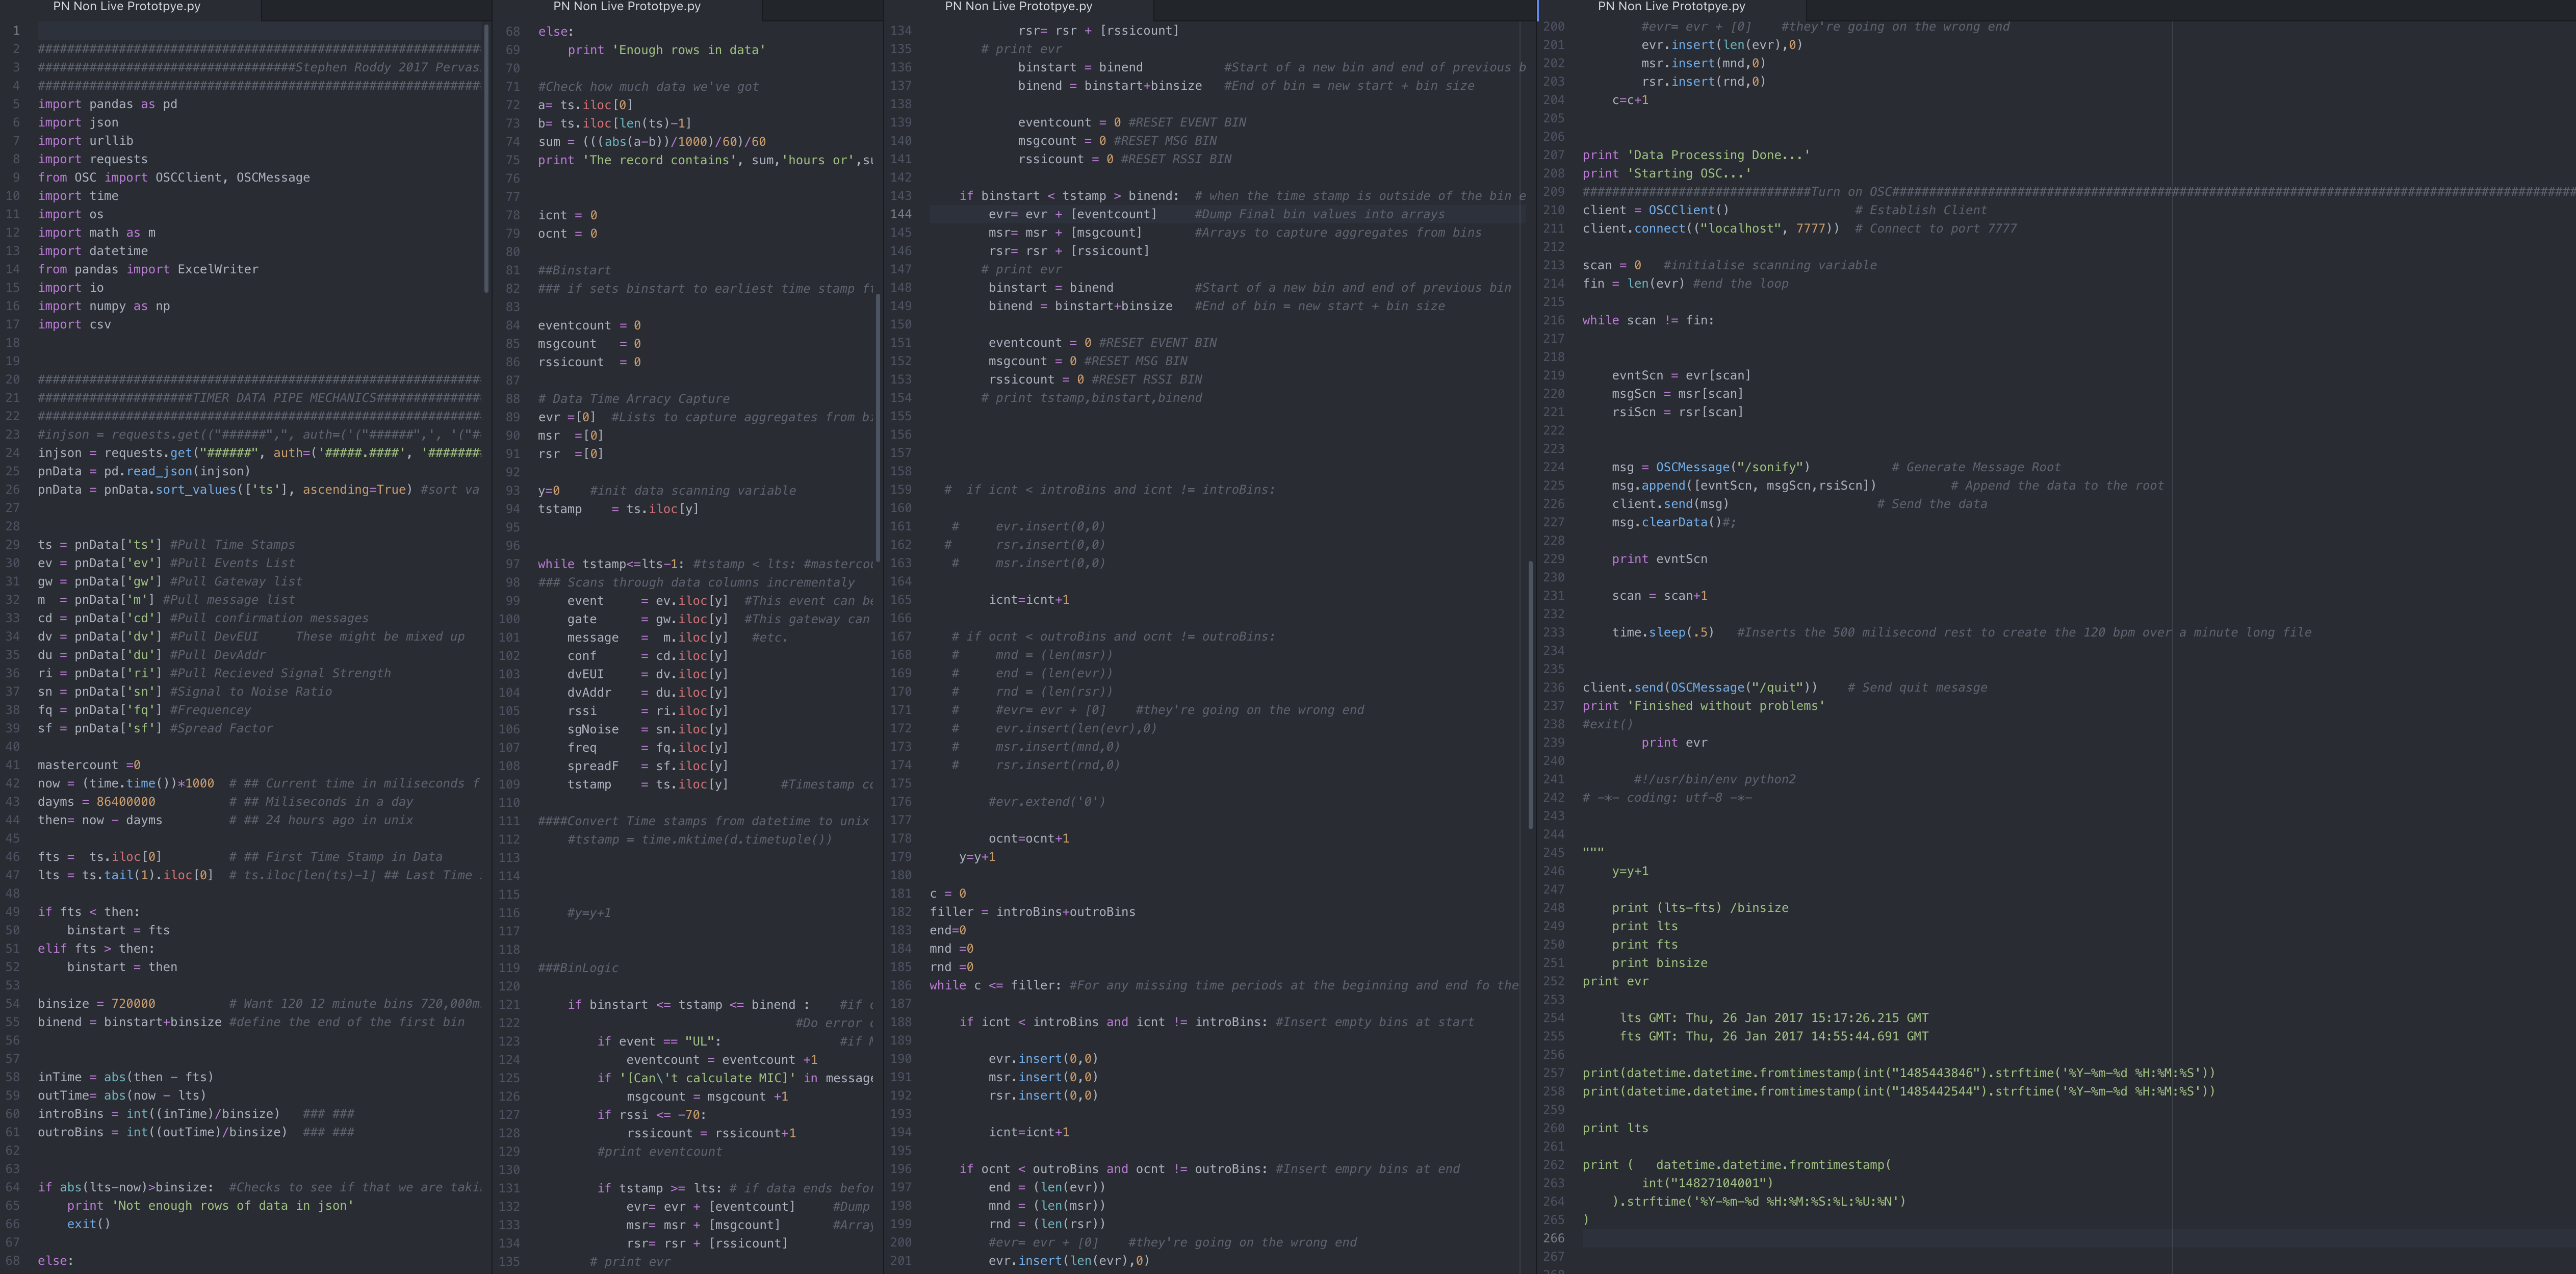
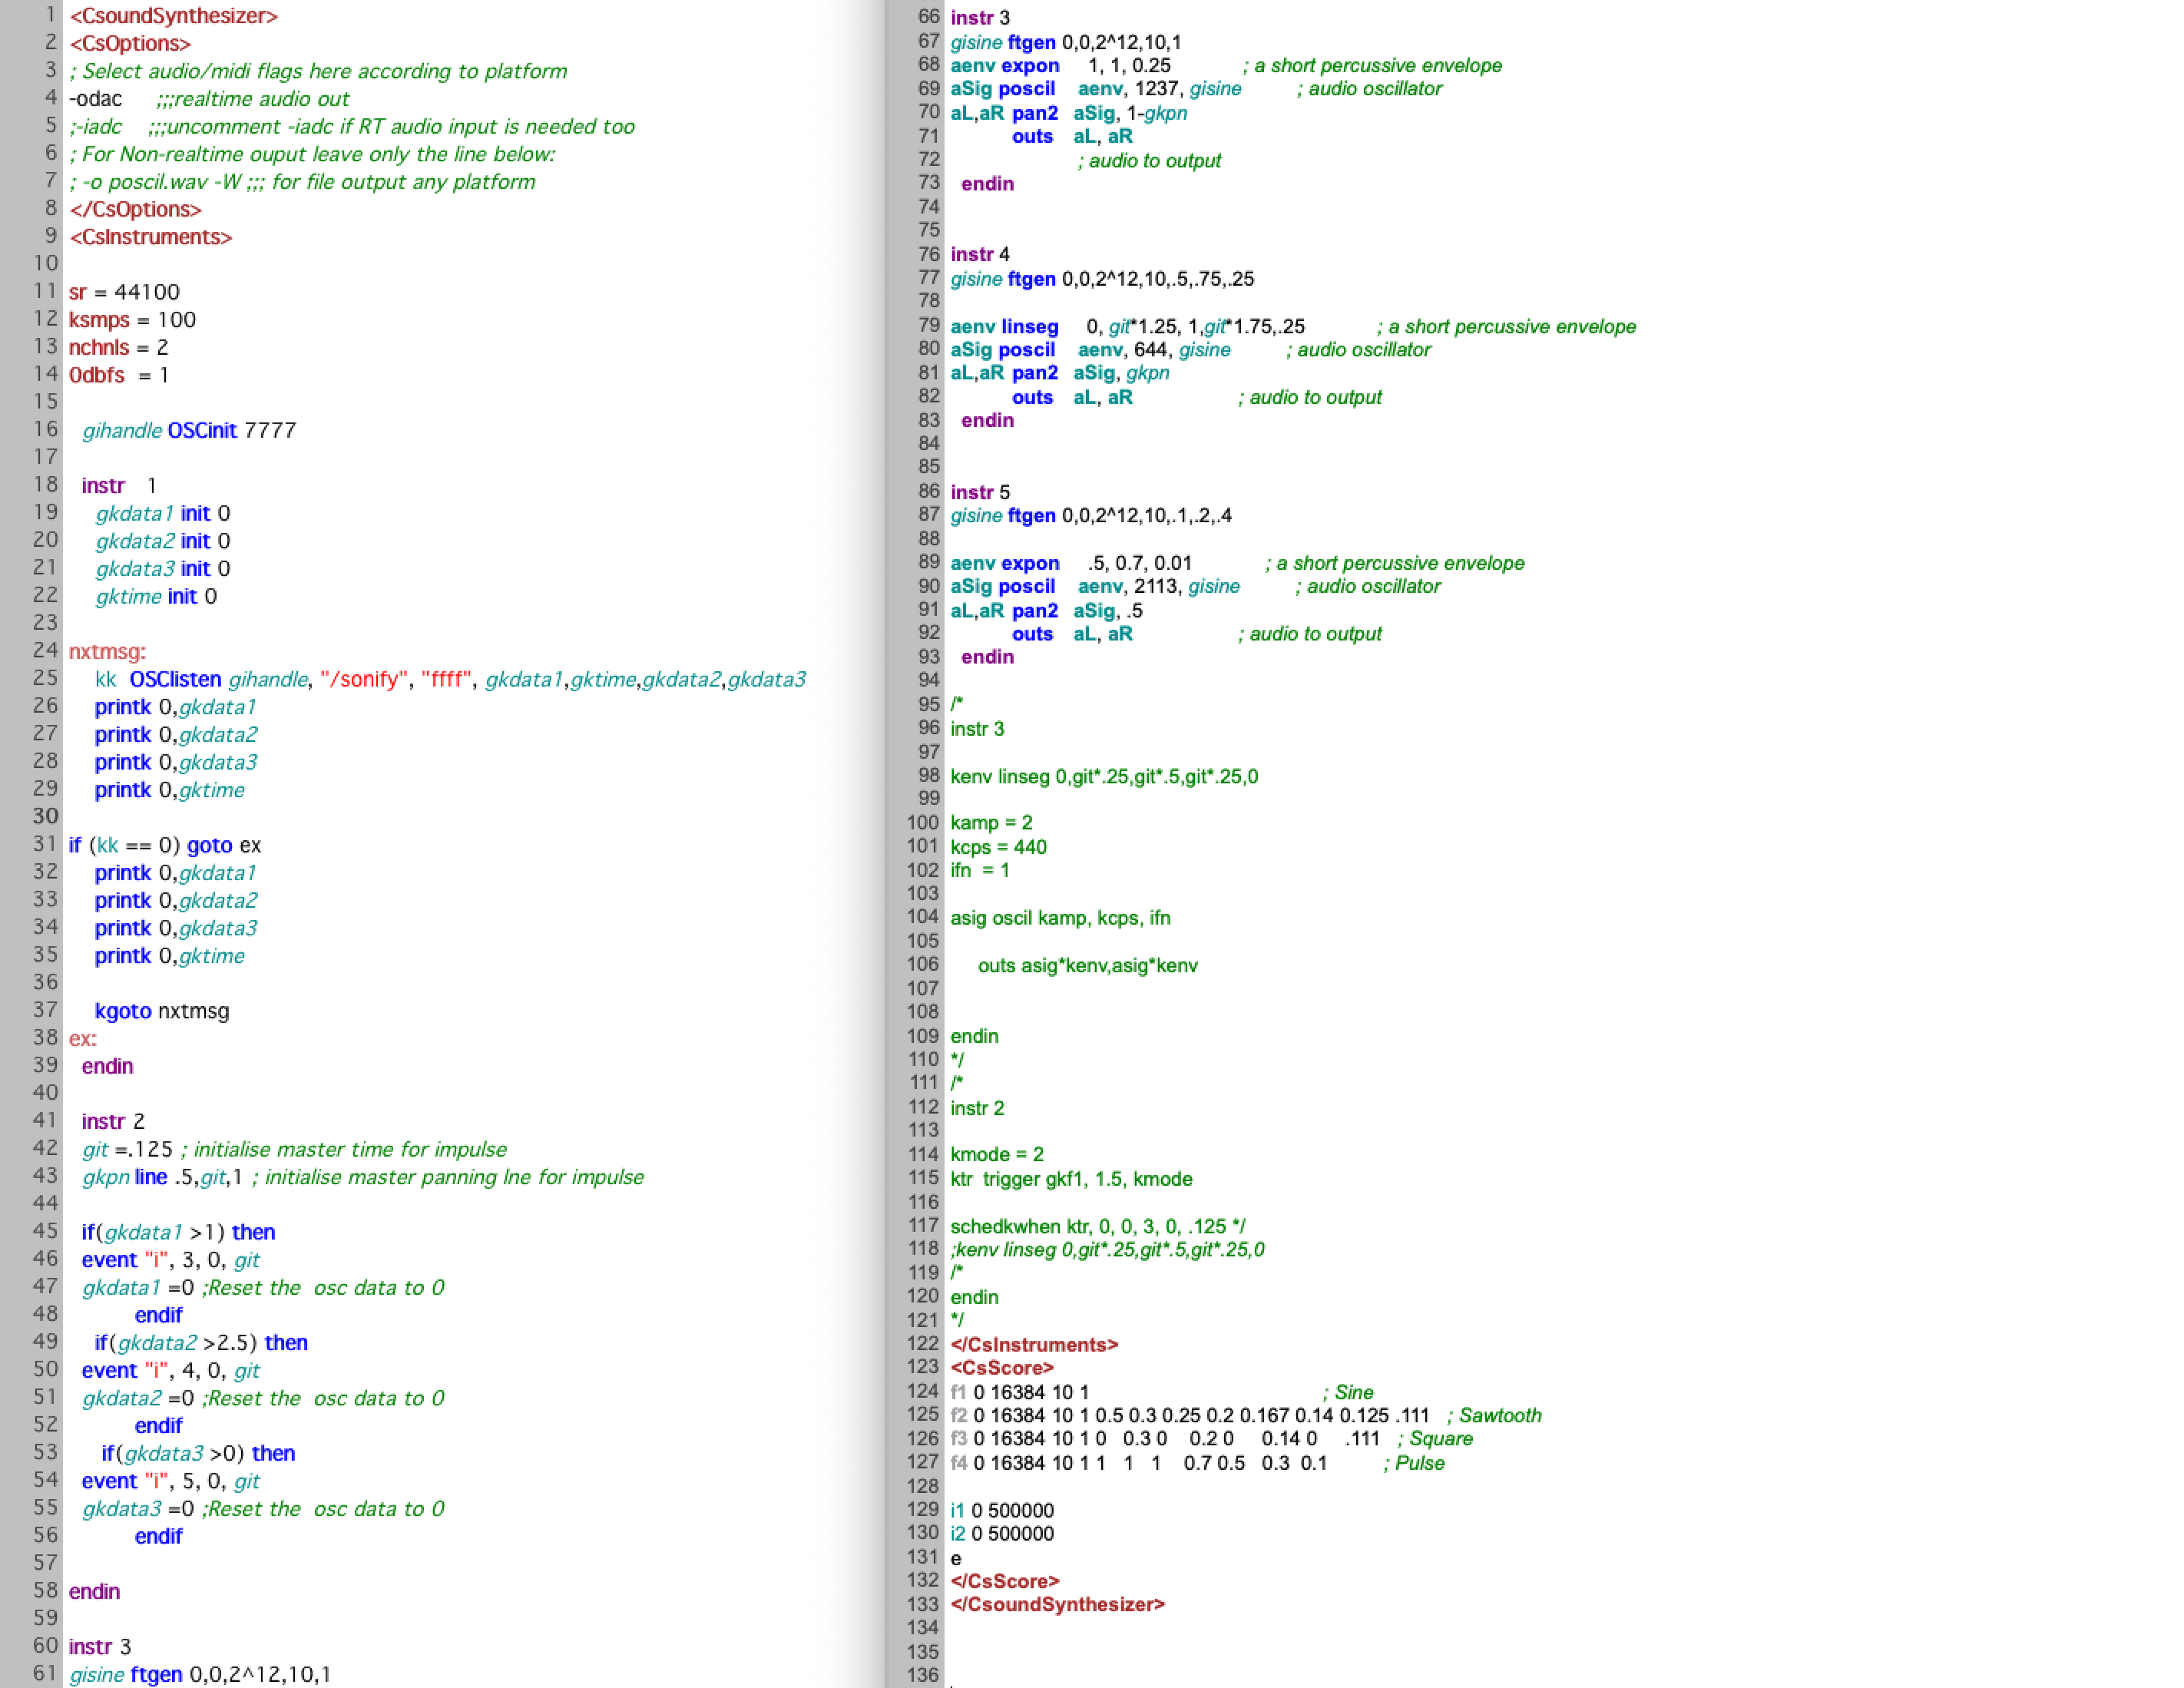
During Phase 1 I wrote code was in Python to retrieve network data from the server with http requests, analysed and structured using pandas and then translated to the Open Sound Control (OSC) protocol using OSC.py. At this point it was ready to be sent to a synthesiser and mapped to sound parameters. A wide range of scripts were written in Csound to represent different network behaviours and map specific datatypes to sound. Patches for mapping the data to sound were also developed in Reaktor 5.
The following examples all represent messages with bad MIC’s (message integrity codes) sent across the network in the 24 hour period between 6pm on Mar 9th and 6pm Mar 10th 2016. In example 3 the bell marks the passage of time
The next examples show the use of different datasets with the same synthesis techniques. The first represents the RSSI strength of active network devices from March 10th to March 11th and the second represents the number of UL messages (uploads) during that timeframe.
Phase 2: Full Networks, Multiple Data Streams.
I then shifted focus to the creation of auditory displays comprised of multiple streams of IoT network data. Mapping strategies that work well in isolation do not necessarily work well in unison. I developed new mapping strategies for representing multiple streams of IoT data. this also required the development of new methods for acquiring, cleaning organising and mapping multiple data streams to OSC and MIDI in Python.
These sonifications represent an aggregate of 3 data types (device, gate and upload messages) sent across the network from 10th to 15th of July 2016. The increase in activity on the network is clearly apparent. The oscillating pitch tone represents the passage of times with one full trough-peak-trough cycle equal to 24hrs. The other sounds are mapped to the represent activity on the network:
The following sonification represents the same data (device gateway and upload messages) from Jun 22nd to July 15th 2016. The data to sound mapping strategy is much richer than the previous examples. There are 2 categories of sound used in this sonification: Impulse sounds and meter sounds. The meters are those sustained sounds that play continuously. They represent average/mean changes in each of the monitored streams of data overall. The impluse sounds are shorter patterns that play once per time unit and highlight to the data recorded within that unit of time.
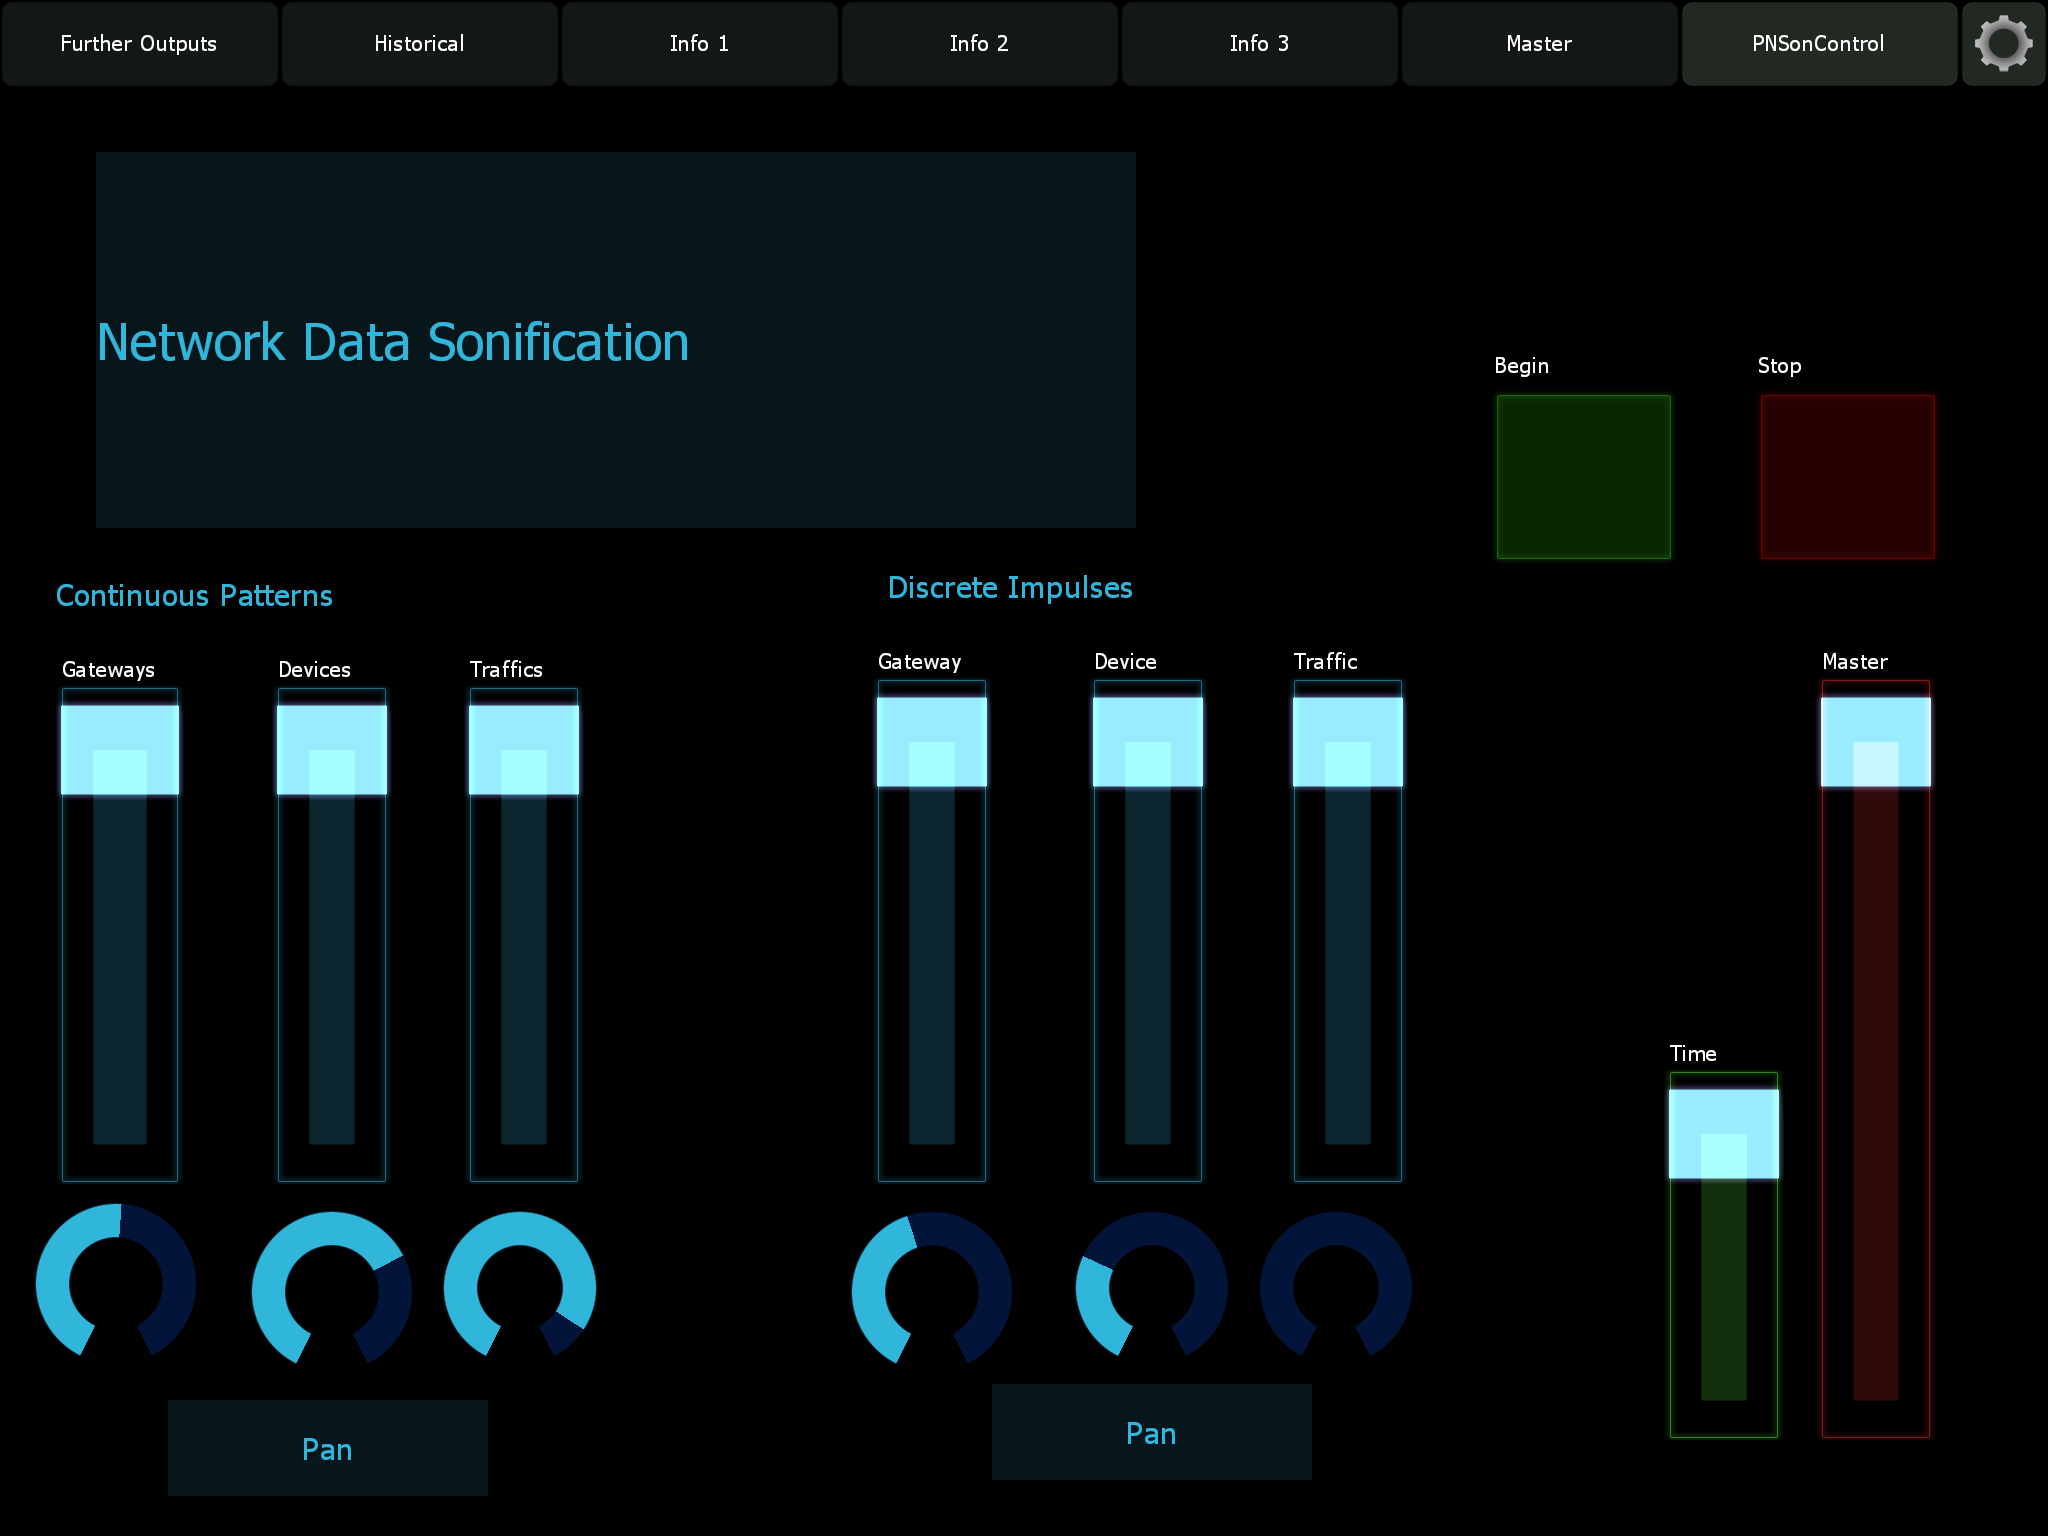
The end result of this phase was an auditory display framework for representing multiple streams of network data at once. It represented both aggregates of network data and continuous streams of data. Users could interact with the system via GUI to focus on specific streams of data and attenuate others.
Phase 3: Refine the Data to Sound Mapping Strategies and Development of Design Principles.
The third phase of the project involved the refinement of the mapping strategies developed in the first two phases and the extension of the approach to represent even more data. Approaches that worked were further developed and expanded upon while those that didn’t were discarded. This phase resulted in the creation of a new framework for sonifying IoT Network data and the creation of a number of design guidelines for future framework. The design guidelines and auditory display framework are presented in the Journal of Sonic Studies.
- Example of Strong RSSI
- Example of High Signal to Noise Ratio
- Sonification of Healthy Network Activity
- Sonification of Standard Network Activity
- Link to JSS Paper
Phase 4: Market Data, Smart Cities, Evolutionary Computing & Machine Learning Techniques.
Having finalised the design of a framework for representing IoT Network Traffic Data and put forward a set of guidelines for developing frameworks of this type, phase four of the project shifted focus again to consider a broader range of data sources. In the original funding application this phase of the project was intended to explore more creative/artistic applications of auditory display. During phase 4 I focused on writing functional code that could to be easily deployed to the web. The two frameworks designed during this phase are designed to run client-side with the standard HTML/Javascript/CSS stack and sound is synthesised using the tone.js library. In introduced Machine Learning (MuiscVAE, a javascript based variational autoencoder implementation created for musical data by the Google Magenta team) and Evolutionary Computing techniques (mostly genetic algorithms) to aid in the process of mapping data to sound. First, I created an ambient auditory display solution for monitoring financial markets. The data was from the from highly volatile 2018 cryptocurrency markets. It represented the live dollar values of different cryptocurrencies, retrieved via the Coinbase Pro API (originally GDAX). I created multiple mapping strategies for this data, some to generative musical pieces that would represent the overall state of the data in a more stimulating and creative manner and others to more straightforward sound parameters similar to auditory graphs. The framework makes use Evolutionary Computing and Machine Learning techniques. It was presented at the 2018 conference on the Computer Simulation of Musical Creativity.
This framework works around the idea of target states. Target states of interest in the market data are associated with unique musical structures. As the data tends towards these target states the audio tends towards the musical motif. This way the listener can gauge how close the market is to the target state by listening to how much the musical motif differ from the target state pattern.
This is implemented at the generative level using Genetic Algorithms (GA):
and Variational Autoencoders (VAE):
It is implemented at the sound synthesis level by defining target timbral qualities for each audio stream. This results in a scales of timbral changes that can be used to represent the data, in relation to the target states described above.
Bringing these steams together results in musical systems which are representative of the difference between target data states defined by a user, and the current state of the market:
ICAD 2021 Poster Object
Smart Cities Data
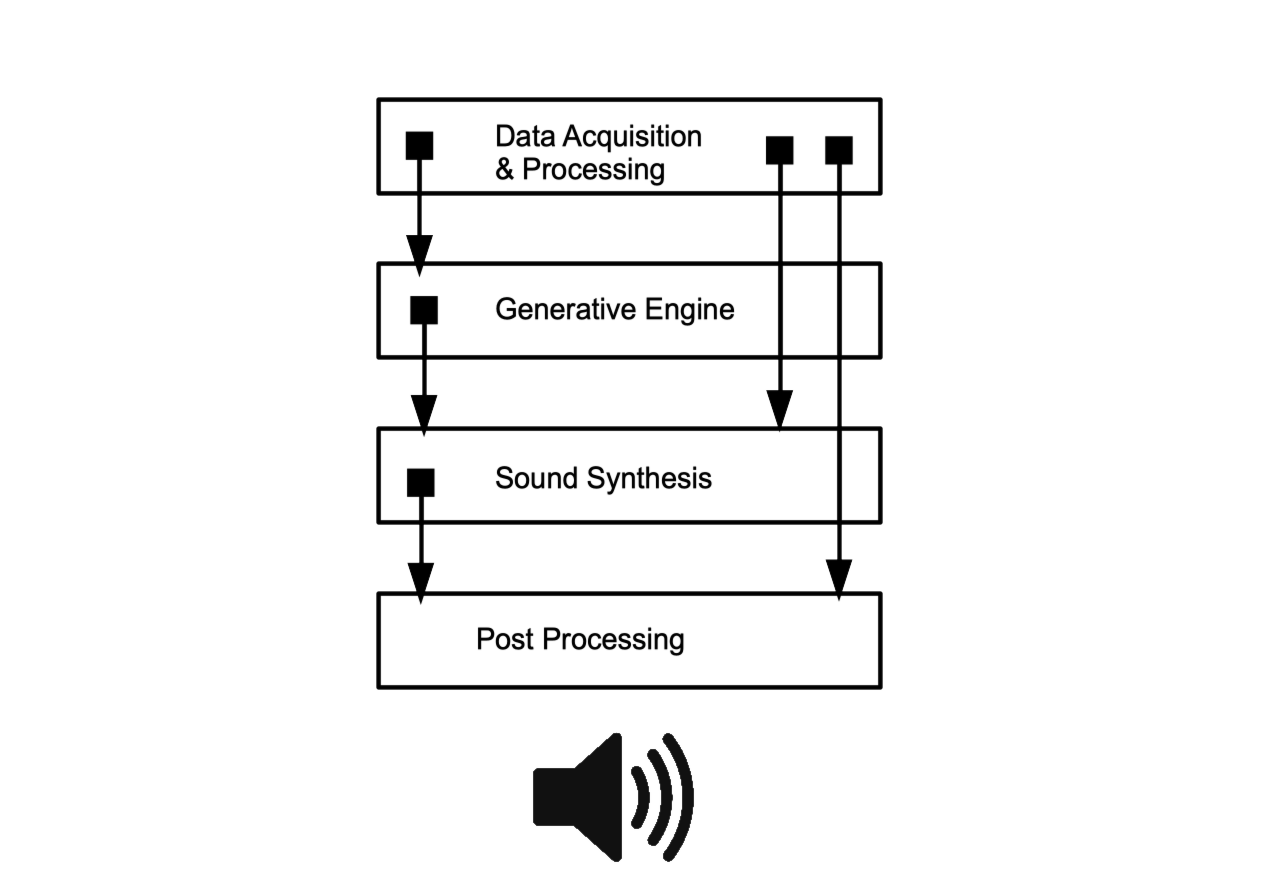
This final phase of the project also involved the development of a framework for Smart Cities data. Rather than dealing with data at the level of the network, this phase investigated the use of sensor level data. The framework uses traffic data from open APIs around Dublin including Noise level data (Sonitus Systems API), number of public bikes available at stands and number of Free Parking Spaces in multi-storey car parks (Dublin City Council API), Travel Times on key routes around the city (Transport Infrastructure Ireland). It also uses weather data from the OpenWeather Maps API including rainfall, windspeed and temperature levels. Theoretical frameworks from Embodied Cognitive Science and music theory were once again used to guide the initial design of the framework. The framework is comprised of the same four component layers involved in the previous framework and represented in the figure above. The output consists of three data-driven sound objects presented in sequence. The first object represents weather data the second represents traffic data and the third represents the number of available bikes at city bike stands. When attended to in sequence, the sonification is intended to give an overall sense of the state of the city in terms of these three categories.
A number of strategies for mapping data to sound were adopted here. Traditional approaches to mapping data to sound (parameter mapping sonification) were employed alongside approaches that involve machine learning techniques. For example in the generative engine the highest point in the dataset is represented with a unique musical pattern and the lowest point is represented with another. By blending these motifs together using MusicVAE new musical patterns are generated to represent values between these two points. Essentially, the high point of the data is represented with one musical motif and the low point with another one. All data points in between are then represented as blends of these two motifs. This is a refinement of the target states approach I used for the previous framework.
Data is mapped across the generative, sound synthesis and post-processing layers for each data object.
Weather Data Object:
| Data | Sound | Layer |
|---|---|---|
| Rainfall | Motif Blending | Generative |
| Degree Temperature | Harmonicity Ratio | Sound Synthesis |
| Degree Temperature | Chorusing | Post-processing |
| Windspeed | Panner Freq & Filter Freq | Post-processing |
Synthesis Method: Two Sine wave Generators w/amplitude envelopes + one filter & filter envelope each.
Rainfall data is mapped to control the blending of the Rain motif into the Shine motif. With higher rainfall values the musical pattern sound closer to the Rain motif with lower values it sounds closer to the Shine motif. The motif is synthesised using two monophonic synths
In the following example the rain motif transforms into the shine motif.
At the sound synthesis level Temperature data is mapped to control the harmonicity ratio between two monophonic synthesisers and at the post processing level it is mapped to control a chorusing effect.
Windspeed is mapped to control the cycle frequency of an automatic filter at the FX layer.
Traffic Data Object:
| Data | Sound | Layer |
|---|---|---|
| Traffic Times | Motif Blending | Generative |
| Noise Data | Distortion | Post-processing |
| Noise Data | Reverb | Post-processing |
| Parking Spaces | Low Pass Filter | Post-processing |
Synthesis Method: AM Synthesis.
Average travel time data for the motorways feeding Dublin is mapped to control the blend between the low traffic motif and the high traffic motif in the generative engine. Noise level data is mapped to control the addition fo distortion and reverb to the signal. The number of free carpark spaces in the city is mapped to control the cutoff frequencey of a lowpass filter.
In the following example the high traffic motif transforms into the low traffic motif:
Bike Data Object:
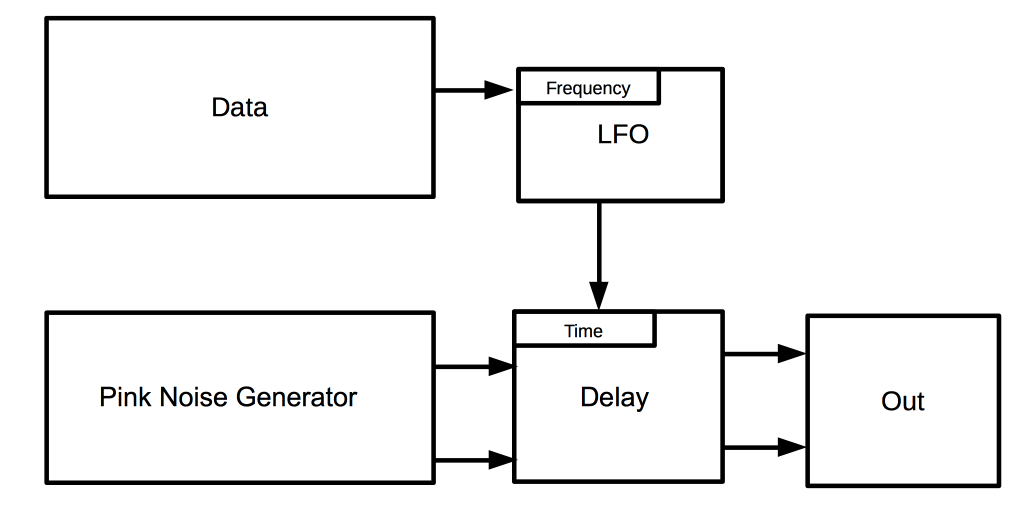
The bike data object consists of a pink noise generator and a ping pong delay. In a ping pong delay the echo swaps back and over between left and right channels each time it is heard. I mapped the data from the number of available bikes in the city to control the rate at which this takes place.
The following is an example sonification with this framework. It represents good weather slight chance of rain above average traffic and few free bikes:
The Outputs
This project resulted in a large body of outputs across a range of disciplines. Some of these explored the technical aspects of the frameworks created while others considered the aesthetic, theoretical and social dimensions involved this research project.
You can read our recent ICAD 2021 paper here:
Book Chapter
Journal Article
Conference Papers
- Roddy S., & Bridges B. (2021) The Design of a Smart City Sonification System Using a Concpetual Blending and Musical Framework, Web Audio and Deep Learning Techniques @ The International Conference on Auditory Display 2021
- Roddy, S. (2018) Ambient Data Monitoring w/Generative Music Systems using Evolutionary Computing & Machine Learning Techniques. CSMC 2018, Dublin, August 2018.
- Roddy, S. (2017) Absolute Nothingness: The Kyoto School and Soundart Practice. In Proceedings of Invisible Places 2017.
- Sounding Human with Data: The Role of Embodied Conceptual Metaphors and Aesthetics in Representing and Exploring Data Sets @ Music Technology Workshop 2016, Michael Smurfit Business School, University College Dublin, June 10th 2016
Invited Science Communication
Conference Presentation
Invited Talks
- “Whose Music?”: Panel Discussion on AI in Music Composition at Music Current 2019, CMC Dublin
- Data-driven Sound for Raising Awareness, Public Outreach and Insight Generation in Complex Data Sets @ I.NY Creative Education Symposium, Irish World Academy, University of Limerick, October 11th 2017
- Sonification, Sound Art & IOT @ The Arts and Technology Research Lab, Trinity College Dublin, December 12th 2016
- Embodied Sonification @ D.A.T.A: Dublin Arts and Technology Association, The Connect Centre, November 3rd 2016.
- Sonification @ The Connect Centre for Future Networks and Communications, Trinity College Dublin, August 2016
- Sounding Human with Data. @ The International Digital Empathy Workshop, Ulster University, October 31st 2016
Creative Skills
HCI Design. Interaction Design. UX Design. Sound Design. Music Composition. Data Sonification. Data Visualisation.
Technical & Research Skills
HTML/CSS/Javascript. Python. Csound. OSC& MIDI. Programming. Data Analysis. Audio Engineering. Recording. Data Analysis. Data Sonification. Data Visualisation. User Evaluations. A/B Testing. Experimental Design. Distributed User Testing.
Tags
Sonification. Auditory Display. Internet of Things Networks. Smart Cities. Embodied Cognition. Machine Learning. Data. Stephen Roddy.
Hosted on GitHub Pages — Theme by orderedlist
Page template forked from evanca